I was experimenting to see what the effect of different interpolations would be on a simple real value, ranging from 0.0 on the left to 1000.0 on the right, over 100 frames.
My idea was
- create a .sif file which just made a rectangle grow from 0px wide to 1000px, over 100 frames
- use a Python script to modify that .sif file to change the left and right interpolations
- run Synfig on that .sif file, obtaining 100 .png files
- check them all, again with Python, to see how wide the rectangle is
Somewhat to my surprise, I find that TCB and clamped are effectively the same as linear, which makes me think I’ve messed up somewhere:
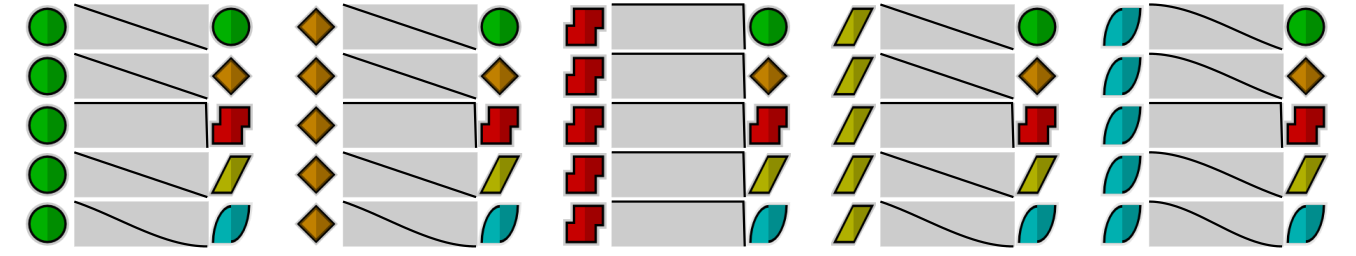
Or have I been misunderstanding the way TCB and clamped are supposed to work?
Hacky code and results here: Marnanel Thurman / interpolation-test · GitLab