I just experimented with the parameters of the TCB Interpolation and wrote down my findings to http://synfig.org/wiki/TCB. As far as i can see this settings aren’t hard to understand, but the value ranges giving me some headache. They are not very intuitive and usually you wont want to change them.
That gives me the thought if it is not possible to display/plot them directly inside the drawing-window. Would give you a good insight which path vertices will move and giving you a better view what you are doing with this parameters.
Hey niabot,
thanks for the TCB researching and clarifications.
By the “drawing window” you mean the canvas? Isn’t the Draw panel enough for you?
Remember that you can edit a waypoint but right click on it and select “Edit” and then, when the waypoint dialog is shown you can see the changes of the dialog by pressing apply, so the Draw panel updates with the current TCB value.
I meant it in a other way. If you just look at one vertex and play an animation you will see it’s movement. It forms a curve depending on the waypoints and interpolation (and parameters) used. This curve is something like the timeline but plotted with x,y instead of just one value over time. It shows you the exact movement of the vertice.
Given this line/curve is displayed for all selected vertices you get a good feeling how they get interpolated. You would even be able to see the effect of the TCB-Paramters before applying them and watch what effect it has on the animation. For example for a bouncing ball you could see how its movement curve would be affected. Drawing some dots near the current frame would also give you a good feeling about the speed in the animation.
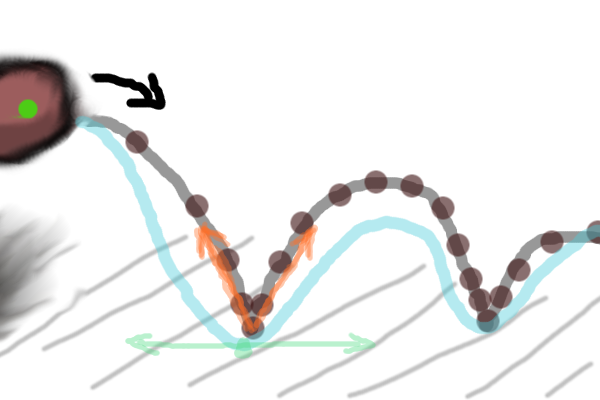
I quickly draw a dirty illustration of what i mean. As you can see the ball will jump from left to the right. following its origin would give the gray line. In default interpolation mode it would follow the bluish line, since the tangent is stretched. Changing the continuity (little lower than -1.0) and temporal tension would result in the gray line as the path for the origin. As you might notice it is totally not intuitive to do if you don’t have this lines displayed. Displaying them on the canvas would greatly improve the setting of this parameters. Doing it this way you would only need keyframes at the top and bottom positions.
Small dots could indicate the position at the keyframes, which would also make timing/speed visible to the animator.
Just found out that synfig uses Kochanek–Bartels splines for interpolation. It got simply extended by a fourth parameter influencing the progress over time.
What you suggest is very similar to the “onion skin” feature. But instead showing the dots (or “ducks” as we call them) for the future (and past maybe) progression of the vertex.
In order to change those parameters in a graphical way, then those “ducks” would need to be editable, which I assume it’s not an easy thing to do.
Maybe the user should specify when to show these for an specific vertex (or any other type of duck). Otherwise the viewport will get cluttered very fast. A large number of duck can also slow the program down real bad.
Editable curves in the canvas seems cool, but isn’t this what the Curves panel should show? Having editable curves there (with vertex handles instead of the waypoint editor panel) would be far more efficient in my view.
Apart from that, great work on documenting the TCB niabot!
I meant not to use the curves in the canvas to modify the interpolation. It should just be a visualization, so that you can better see what the TCB parameters will do and how they affect the interpolation. Inside the curveseditor the curves should really be able to be manipulated by the user. It’s not totally necessary, but at least you should have a better indication what you achieve by moving keyframes or changing interpolationtypes.